
Integrating NATS and JetStream: Modernizing Our Internal Communication
Discover how Brokee transformed its microservice architecture from a chaotic spaghetti model to a streamlined, reliable system by integrating NATS.io. Leveraging NATS request-reply, JetStream, queue groups for high availability, and NATS cluster mode on Kubernetes, we achieved clear communication, scalability, and fault-tolerant operations. Learn how NATS.io empowered us to build a robust event-driven architecture tailored for modern DevOps and cloud engineering needs.
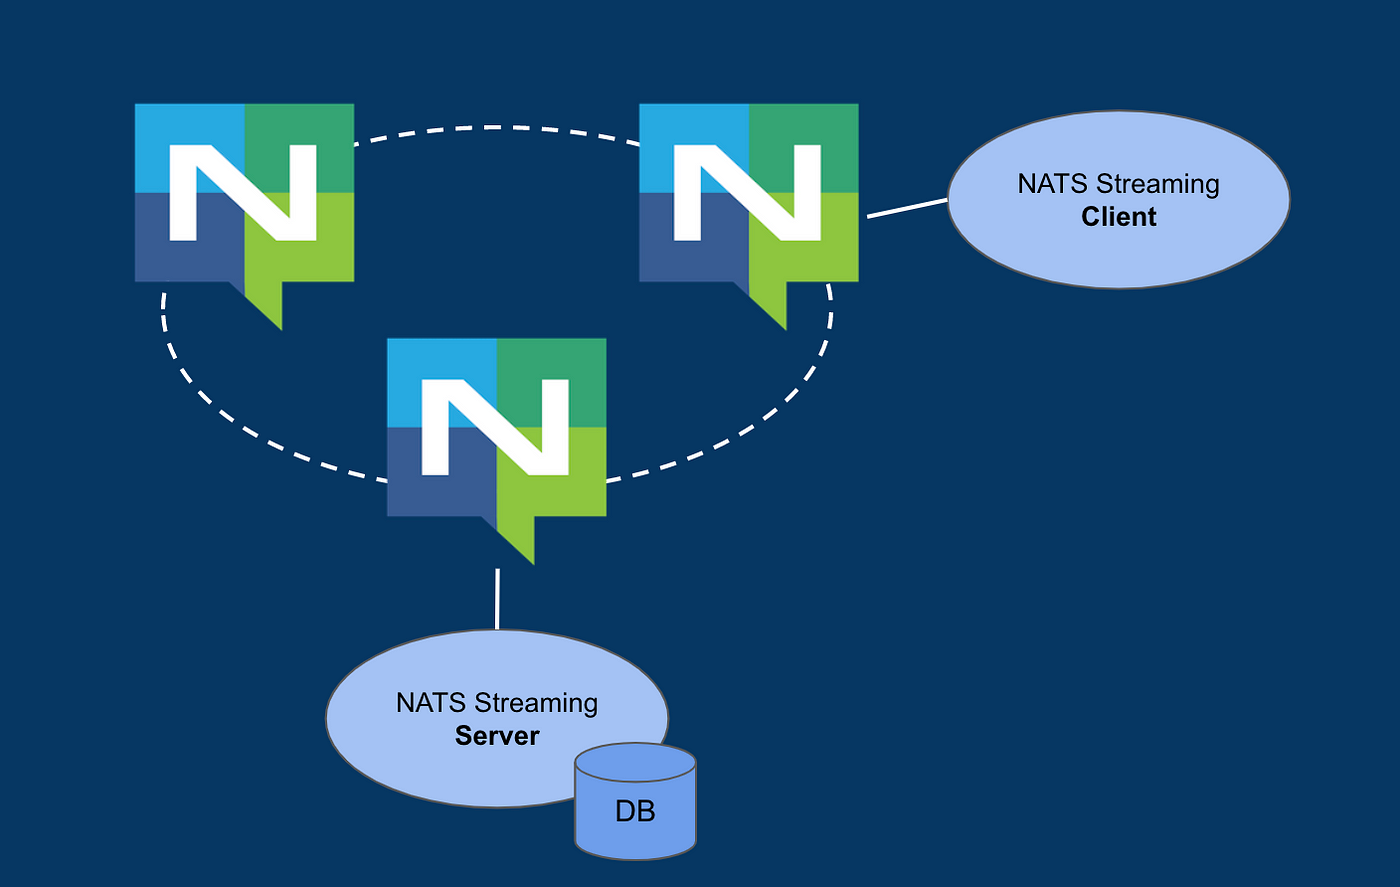
High-level NATS architecture
Introduction
Brokee was built using microservice architecture from day one as the initial focus for skills assessment was Kubernetes, and later we expanded to other technologies. At the same time, as new services were added, we sometimes took shortcuts with design decisions. Over the years, it resulted in a spaghetti architecture where many services were interconnected with each other and it became harder and harder to reason about dependencies and figure out which functionality should go to which service.
Discover how we improved our system's communication by integrating NATS messaging system and their JetStream functionality. We delve into the challenges we faced, the lessons we learned, and how we simplified our setup to make it more efficient. This integration has laid the foundation for a more scalable and resilient infrastructure, enabling us to adapt and innovate as our platform grows.
Why Change?
Our previous architecture relied heavily on a synchronous request-response model. While this served us well initially, it began to show limitations as our platform grew:
Scalability issues: Increasing traffic caused bottlenecks in our services.
Lack of flexibility: Adding new features required significant changes to the existing communication flow.
Reduced reliability: Single points of failure in the system led to occasional downtime.
Even though we use backoff and retry strategies in our APIs, requests can still fail if the server is unreachable, unable to handle them, or overwhelmed by too many requests. We needed a more robust, asynchronous system that could scale effortlessly. That’s when we turned to NATS and JetStream, which offered persistence.
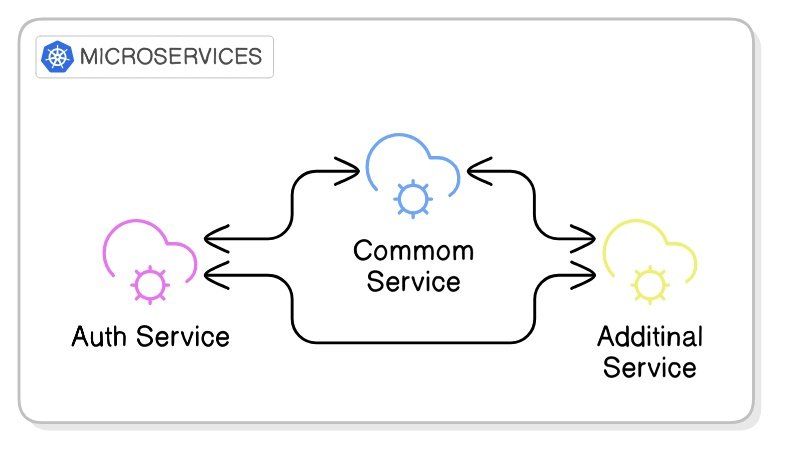
Old architecture: tightly coupled services using synchronous request-response communication.
What is NATS and JetStream?
NATS is a lightweight, high-performance messaging system that supports pub/sub communication. JetStream extends NATS by adding durable message storage and stream processing capabilities, making it ideal for modern, distributed systems. For developers using the SDK, NATS offers support for a variety of programming languages, making it a flexible solution for integrating messaging capabilities.
With NATS and JetStream, we could:
Decouple services: Allow services to communicate without direct dependencies.
Enable persistence: Use JetStream’s durable subscriptions to ensure no messages are lost.
Simplify scaling: Seamlessly handle spikes in traffic without major architectural changes.

New architecture: decoupled services with asynchronous pub/sub communication via NATS.
The Integration Process
Here’s how we integrated NATS into our platform:
1. Setting Up NATS
We deployed NATS using Helm. Helm made the installation and configuration straightforward, allowing us to define resources and dependencies in a consistent, repeatable way.
To ensure reliability and scalability, we set up 3 running server instances of NATS, leveraging its clustering capabilities and the Raft consensus algorithm to handle increased traffic and provide fault tolerance.
For storage, we used persistent volumes, ensuring durability. NATS also offers the option to use memory-based storage. However, to optimize memory usage and prevent overload on our nodes, we decided to switch to persistent volume storage.
Additionally, we made the deployment more resilient by ensuring NATS instances were safely scheduled on separate nodes to avoid single points of failure and ensure high availability. We opted for the NATS headless service type as NATS clients need to be able to talk to server instances directly without load balancing.
config:
  jetstream:
    enabled: true
    fileStore:
      enabled: true
      pvc:
        enabled: true
        size: 10Gi
        storageClassName: premium-rwo-retain
  cluster:
    enabled: true
    replicas: 3

statefulSet:
  merge:
    spec:
      template:
        metadata:
          annotations:
            cluster-autoscaler.kubernetes.io/safe-to-evict: "false"

podTemplate:
  topologySpreadConstraints:
    kubernetes.io/hostname:
      maxSkew: 1
      whenUnsatisfiable: "DoNotSchedule"
2. Migrating to Pub/Sub
Our first step was replacing direct request-response calls with pub/sub communication. For example:
Before: Common Service would send an HTTP request directly to Auth Service and await a response.
After: Common Service publishes a message to the subject
auth.users.roles.assign, which is then processed asynchronously by the Auth Service that subscribes to this subject.
We incorporated the Request-Reply pattern, which NATS makes simple and efficient using its core pub/sub mechanism. In this pattern, a request is published on a subject with a unique "inbox" reply subject. Responders send their replies to the inbox, enabling real-time responses. This approach is particularly useful for scenarios requiring immediate feedback.
To distribute the workload randomly across multiple instances, the Auth Service subscribes as part of a queue group, ensuring messages are distributed to different instances. NATS automatically manages to scale responders through these groups and ensures reliability with features like "drain before exiting" to process pending messages.
In the next Golang example, we prepare a payload and publish it as a request to a mentioned subject from the Common service using NATS. This demonstrates how the Request-Reply pattern enables sending data to a subject and awaiting a response.
func NATSRequestAssignCompanyRoleForUser(
    nc *nats.Conn,
    userID string,
    roleID string,
    timeout int,
) error {
    // subject -> 'auth.users.roles.assign'
    subject := models.Nats.Subjects.UsersRoleAssign

    payload := models.RoleAssignmentPayload{
        UserID:  userID,
        RoleIDs: []string{roleID},
    }

    payloadBytes, err := json.Marshal(payload)
    if err != nil {
        return fmt.Errorf("failed to marshal payload: %w", err)
    }

    msg, err := nc.Request(subject, payloadBytes, time.Duration(timeout)*time.Second)
    if err != nil {
        return fmt.Errorf("failed to send NATS request: %w", err)
    }

    var response map[string]interface{}
    if err := json.Unmarshal(msg.Data, &response); err != nil {
        return fmt.Errorf("failed to unmarshal response: %w", err)

    }

    success, ok := response["success"].(bool)
    if !ok || !success {
        return fmt.Errorf("role assignment failed, response: %v", response)
    }

    return nil
}
In this example, we set up a subscriber with a queue group that listens to the same subject in the Auth service. The queue group ensures load balancing among subscribers, while the handler processes the requests with the relevant business logic, sending responses back to the requester.
func SubscribeToRoleAssignQueue(
    nc *nats.Conn, handler func(msg *nats.Msg),
) error {
    _, err := nc.QueueSubscribe(
        models.Nats.Subjects.UsersRoleAssign,
        models.Nats.Queues.UserRolesAssign,
        func(msg *nats.Msg) {
            handler(msg)
        })
    if err != nil {
        return err
    }
    return nil
}
In a typical pub/sub setup, if a service fails or is unavailable, there’s no automatic way to repeat the message, and it can fail silently. To address this, we turned to JetStream, which provides message persistence and reliable delivery. With JetStream, even if a service goes down, messages can be reprocessed once the service is back online, ensuring no data is lost and improving overall system reliability.
3. Implementing JetStream
JetStream added persistence to our messaging:
Streams: We defined streams to capture messages, grouping related data for efficient processing. For example, an
stack.deletecould store all stacks destroying messages, ensuring messages are retained and available for subscribers even during downtime.In the example below, we defined a JetStream stream named
STACKSfor managing testing stack operations. It subscribes to a single subject,stack.deletebut multiple subjects can be specified. The stream has a 1GB storage limit (maxBytes) and uses file storage with three replicas for fault tolerance. The retention policy is set toworkqueue, ensuring messages are retained until processed, and once a message is acknowledged, it will be deleted from the stream. It connects to the specified NATS server instances for message handling.
apiVersion: jetstream.nats.io/v1beta2
kind: Stream
metadata:
  name: stacks
spec:
  name: STACKS
  description: "Manage stack operations"
  subjects: ["stack.delete"]
  maxBytes: 1073741824
  storage: file
  replicas: 3
  retention: workqueue
  servers:
    - "nats://nats-headless.nats-system:4222"
Durable Subscriptions: Services could subscribe to streams and resume from where they left off, ensuring no data loss.
To provide flexibility and control over JetStream and consumer (a component that subscribes to a stream and processes the messages stored in that stream), we manage configurations through a manifest chart using JetStream Kubernetes controller called NACK, minimizing the need for code editing and rebuilding.
In the code, only minimal edits are required for specifying the subject, consumer, and queue group names. This approach ensures the configuration of streams and consumers is easily adjustable.
Additionally, we use push mode for streams, where messages are handled when placed in the queue. For durable queue consumers, the consumer and delivery group names must be the same to maintain consistency and work as expected.
Backoff and Acknowledgments: We use backoff in consumer configuration to control the number of retry attempts for message redelivery. Additionally, we set
ackWaitandmaxDeliverto define how long to wait before knowing if a message is acknowledged and after will be delivered.In some places, we use backoff, while in others, we use
ackWaitwith maxDeliver. You can use either backoff orackWait, but not both together: for multiple retries, backoff is preferred; for fewer retries,ackWaitis set to the execution time of your handler plus an additional 20-30% buffer, ensuring sufficient time to prevent premature exits and unacknowledged message.We also manually acknowledge messages after executing code, particularly in cases where validation fails due to invalid data, as there’s no need to redeliver the message. This helps to avoid unnecessary retries.
The next configuration sets up a JetStream consumer named
stack-deletefor the deletion of infrastructure stacks. It subscribes to thestack.deletesubject same as in stream subjects(viafilterSubject) and uses a durable nameSTACK_DELETE, ensuring message delivery resumes from where it left off.
apiVersion: jetstream.nats.io/v1beta2
kind: Consumer
metadata:
  name: stack-delete
spec:
  ackPolicy: explicit
  ackWait: 20m
  deliverGroup: STACK_DELETE
  deliverSubject: deliver.stack.delete
  deliverPolicy: all
  description: Delete stack resources
  durableName: STACK_DELETE
  filterSubject: stack.delete
  maxAckPending: 1000
  maxDeliver: 5
  replayPolicy: instant
  servers:
    - "nats://nats-headless.nats-system:4222"
  streamName: STACKS
An example of using backoff instead of ackWait: By setting the desired retry interval instead of using ackWait, we ensure the total backoff interval is less than the maxDeliver value, or it will fail during creation/update. If there’s free interval capacity, it will reattempt with the last backoff interval.
...
spec:
  ackPolicy: explicit
  backoff:
    - 1m
    - 5m
    - 10m
Key settings include:
ackPolicy: Explicit acknowledgment ensures messages are redelivered if not acknowledged.
ackWait: Set to 20 minutes to accommodate infrastructure destruction that can take up to 10-15 minutes in some cases.
deliverGroup & deliverSubject: Enables queue group-based delivery to
STACK_DELETE, ensuring load balancing among subscribers.maxAckPending: Limits unacknowledged messages to 1,000.
maxDeliver: Allows up to 5 delivery attempts per message, retrying every 20 minutes. If the message is not acknowledged after 5 attempts, it will remain in the stream.
replayPolicy: Instant replay delivers messages as quickly as possible.
servers: The consumer connects to the
STACKSstream on specified NATS servers for processing messages.
Next, we send a message to the stack.delete subject to request the deletion of a stack (the following example is written in Python). The process is straightforward: we create a message with the necessary information (userhash and test_id), and then publish it to the NATS server. Once the message is sent, we close the connection and return a response indicating whether the operation was successful or not.
async def delete_infra_stack(
    userhash: str,
    test_id: str,
) -> Dict[str, str]:

    try:
        nc = NATS()
        await nc.connect(servers=[NATSConfig.server_url])

        message = {"candidateId": userhash, "testId": test_id}

        await nc.publish(
            subject=NATSConfig.sub_stack_delete,
            payload=json.dumps(message).encode("utf-8"),
        )

        await nc.close()

        response = {
            "success": True,
            "message": f"Published {NATSConfig.sub_stack_delete} for {userhash}-{test_id}",
        }
    except Exception as e:
        response = {
            "success": False,
            "message": str(e),
        }

    return response
In the next code snippet written in Golang (we use multiple languages for our backend code), the consumer subscribes to the stack.delete subject using the STACK_DELETE durable name. This allows the consumer to handle stack deletion requests while maintaining message persistence and retry logic as configured in JetStream. As you may notice subscribing is pretty straightforward as we manage the consumer configuration through the chart, which simplifies setup and allows easy adjustments without complex code changes.
func SubscribeToJSDestroyStack(js nats.JetStreamContext, svc Service) error {
    subject := Nats.Subjects.StackDelete
    durableName := Nats.DurableName.StackDelete

    _, err := js.QueueSubscribe(subject, durableName, func(msg *nats.Msg) {
        handleDeleteStack(msg, svc)
    }, nats.Durable(durableName), nats.ManualAck())

    if err != nil {
        return fmt.Errorf("Error subscribing to %s: %v", subject, err)
    }

    return nil
}

func handleDeleteStack(msg *nats.Msg, svc Service) {
    var req deleteStackRequest
    if err := json.Unmarshal(msg.Data, &req); err != nil {
        // ack on bad request data
        msg.Ack()
        return
    }

    if _, err := svc.DeleteStack(context.Background(), req.TestId, req.CandidateId, msg); err == nil {
        // ack on success
        msg.Ack()
    }
}
4. Testing and Optimisation
We rigorously tested the system under load to ensure reliability and fine-tuned the configurations for optimal performance. Through this process, we identified the ideal settings for our message flow, ensuring efficient redelivery and minimal retries.
Challenges and Lessons Learned
Integrating NATS into our system posed several challenges, each of which provided valuable lessons in how to leverage NATS' features more effectively:
Request/Reply and Durable Subscriptions:
Initially, we thought the request/reply pattern would work well for durable subscriptions, as it seemed like a good way to ensure that every request would be retried in case of failure. However, we quickly realized that request/reply is more suited for real-time, immediate communication rather than long-term durability.
For durability, JetStream turned out to be the better option, as it ensures messages are stored persistently and retried until successfully processed. However, JetStream only delivers each message to a single designated consumer (the one configured to handle it), rather than broadcasting it to all subscribers.
Consumer and Queue Group Names:
We learned that for durable consumers to function properly, the consumer name and the queue group must be the same. If they don't match, the consumer won't subscribe to the stream, leading to issues in message delivery and distribution.This realization came after some trial and error. We tried subscribing to durable subscriptions but encountered errors. To understand what went wrong, we dug into the source code of the SDK and discovered the importance of matching the consumer name and queue group. Surprisingly, we didn’t find this mentioned clearly in the documentation, or perhaps we missed it.
Backoff vs. AckWait:
At first, we experimented with using both backoff and ackWait together, thinking it would allow us to fine-tune the retry behavior. We expected ackWait to control the waiting period for message acknowledgment, and then back off would manage retries with delays.
We first applied changes to the settings through Helm, and there were no errors, so we thought the changes were successfully applied. However, during testing, we noticed that the behavior wasn't as expected. When we checked the settings using NATS-Box Kubernetes pod, we found that the changes hadn’t taken effect. We then tried to edit the configurations directly in NATS-Box but encountered an error stating that the settings were not editable. This led to further investigation, as we realized that only one of either ackWait or backoff should be used to make it work.
Manual Acknowledgment:
One of the key lessons was the importance of manual acknowledgment. During our tests, we encountered situations where, even though the handler failed for some subscriptions, the message was still automatically acknowledged.
For instance, when an internal server error occurred, the message was considered acknowledged even though it wasn’t fully processed. We initially assumed that the acknowledgment would happen automatically if the message was successfully handled, similar to how HTTP requests typically behave.
However, when we moved to manual acknowledgment and controlled the timing ourselves, it worked perfectly. This change prevented false positives and ensured that messages weren’t prematurely acknowledged, even when an error or timeout occurred.
Testing with NATS-Box:
NATS-Box(available as part of NATS deployment) became an invaluable tool for us in testing and creating configurations. It allowed us to experiment and understand the impact of different settings on system behavior, helping us refine our approach to ensure optimal performance in real-world scenarios.
As we mentioned earlier, it helped us uncover small misunderstandings and nuances that weren't immediately obvious, giving us a deeper insight into how our configurations were being applied.
Conclusion
In conclusion, integrating NATS into our system proved to be a fast and efficient solution for our messaging needs. It wasn't without its challenges, but through testing and exploration, we were able to fine-tune the configurations to fit our needs. While we started with a simple setup, we may expand the use of NATS beyond internal communication to incorporate more features like monitoring and dead-letter queues. Additionally, we are considering replacing more of our internal architecture communication with NATS' pub/sub, and even potentially using NATS for external communication, replacing some of our REST APIs.
Based on our experience, using NATS with JetStream for durable messaging has proven to be a solid solution for ensuring reliable communication in our system. If you're looking to improve your system’s communication and explore event-driven architecture, we recommend considering NATS as a scalable and dependable choice, particularly for internal communication needs.

How We Reduced Our Google Cloud Bill by 65%
Learn how we reduced our Google Cloud costs by 65% using Kubernetes optimizations, workload consolidation, and smarter logging strategies. Perfect for startups aiming to extend their runway and save money.

Google Cloud Cost Reduction
Introduction
No matter if you are running a startup or working at a big corporation, keeping infrastructure costs under control is always a good practice. But it’s especially important for startups to extend their runway. This was our goal.
We just got a bill from Google Cloud for the month of November and are happy to see that we reduced our costs by ~65%, from $687/month to $247/month.
Most of our infrastructure is running on Google Kubernetes Engine (GKE), so most savings tips are related to that. This is one of those situations on how to optimize at a small scale, but most of the things can be applied to big-scale setups as well.
TLDR
Here’s what we did, sorted from the biggest impact to the least amount of savings:
Almost got rid of stable on-demand instances by moving part of the setup to spot instances and reducing the amount of time stable nodes have to be running to the bare minimum.
Consolidated dev and prod environments
Optimized logging
Optimized workload scheduling
Some of these steps are interrelated, but they have a specific impact on your cloud bill. Let’s dive in.
Stable Instances
The biggest impact on our cloud costs was running stable servers. We needed them for several purposes:
some services didn’t have a highly available (HA) setup (multiple instances of the same service)
some of our skills assessments are running inside a single Kubernetes pod and we can’t allow pod restarts or the progress of the test will be lost
we weren’t sure if all of our backend services could handle a shutdown gracefully in case of a node restart
For services that didn’t have a HA setup, we had the option to explore HA setup were possible (this often requires installing additional infrastructure components, especially for stateful applications, which in turn drives infrastructure costs up); migrating the service to a managed solution (e.g. offload Postgres setup to Google Cloud instead of managing it ourselves); accept that service may be down for 1-2 minutes a day if it’s not critical for the user experience.
For instance, we are running a small Postgres instance on Google Cloud and the load on this instance is very small. So, when some other backend component needs Postgres, we create a new database on the same instance instead of spinning up another instance on Google Cloud or running a Postgres pod on our Kubernetes cluster.
I know this approach is not for everyone, but it works for us as several Postgres databases all have a very light load. And remember, it’s not only about cost savings, this also allows us not to think about node restarts or basic database management.
At the same time, we are running a single instance of Grafana (monitoring tool). It’s not a big deal if it goes down during node restart as it is our internal tool and we can wait a few minutes before it comes back to life if we need to check some dashboards. A similar approach to the ArgoCD server that handles our deployments - it doesn’t have to be up all the time.
High Availability Setup
Here’s what we did for HA of our services on Kubernetes to be able to get rid of stable nodes, this can be applied to the majority of services:
created multiple replicas of our services (at least 2), so if one pod goes down, another one can serve traffic
configured pod anti-affinity based on the node name, so our service replicas are always running on different nodes:
affinity:
  podAntiAffinity:
    requiredDuringSchedulingIgnoredDuringExecution:
    - labelSelector:
        matchExpressions:
        - key: app.kubernetes.io/name
          operator: In
          values:
          - pgbouncer
      topologyKey: kubernetes.io/hostname
added PodDistributionBudget with a minimum of 1 available pod (for services with 2 replicas). This doesn’t guarantee protection, but as we have automated node upgrades enabled, it can prevent GKE from killing our nodes when we don’t have a spare replica ready
reviewed terminationGracePeriodSeconds settings for each service to make sure applications have enough time to shut down properly
updated code in some apps to make sure they could be shut down unexpectedly. This is a separate topic, but you need to make sure no critical data is lost and you can recover from whatever happens during node shutdown
moved these services to spot instances (the main cost-savings step, the other steps were just needed for reliable service operations)
Experienced Kubernetes engineers can suggest a few more improvements, but this is enough for us right now.
Temporary Stable Instances
Now we come to the part about our skills assessments that need stable nodes. We can’t easily circumvent this requirement (yet, we have some ideas for the future).
We decided to try node auto-provisioning on GKE. Instead of having always available stable servers, we would dynamically create node pools with specific characteristics to run our skills assessments.
This comes with certain drawbacks - candidates who start our skills assessments have to wait an extra minute while the server is being provisioned compared to the past setup where stable servers were just waiting for Kubernetes pods to start. It’s not ideal, but considering it saves us a lot of money, it’s acceptable.
As we want to make sure no other workloads are running on those stable nodes, we use node taints and tolerations for our tests. Here’s what we add to our deployment spec:
nodeSelector:
  type: stable
tolerations:
  - effect: NoSchedule
    key: type
    operator: Equal
    value: stable
We also add resource requests (and limits, where needed), so auto-provisioning can select the right-sized node pool for our workloads. So, when there is a pending pod, auto-provisioning creates a new node pool of specific size with correct labels and tolerations:

Node Taints and Labels
Our skills assessment are running a maximum of 3 hours at a time and then automatically removed, which allows Kubernetes autoscaler to scale down our nodes.
There are a few more important things to mention. You need to actively manage resources for you workloads or pods may get evicted by Kubernetes (kicked out of the node because they are using more resources than they should).
In our case, we are going through each skill assessment we develop and take a note of resource usage to define how much we need. If this was an always-on type of workload, we could have deployed vertical pod autscaler that can provide automatic recommendations of how much resources you need based on resource usage metrics.
Another important point, is that sometimes autoscaler can kick in and remove the node if the usage if quite low, so we had to add the following annotation to our deployments to make sure we don’t get accidental pod restarts:
spec:
  template:
    metadata:
      annotations:
        cluster-autoscaler.kubernetes.io/safe-to-evict: "false"
All of this allows us to have temporary stable nodes for our workloads. We use backend service to remove deployments after 3 hours maximum, but GKE auto-provisioning has its own mechanism where you can define how long these nodes can stay alive.
Optimizations
While testing this setup, we noticed that auto-provisioning was not perfect - it was choosing a little too big nodes for our liking.
Another problem, as expected, creating new node pools for every new workload takes some extra time, e.g. it takes 1m53s for a pending pod to start on an existing node pool vs 2m11s on a new node pool.
So, here’s what we did to save a bit more money:
pre-created node pools of multiple sizes with 0 nodes by default and autoscaling enabled. All of these have the same labels and taints, so autoscaler chooses the most optimal one. This saves us a bit of money vs node auto-provisioning
choose older instance types, e.g. N1 family vs N2 which is newer but a bit more expensive. Saved some more money
Plus, got faster test provisioning as node pools are already created, and we still have auto-provisioning as a backup option in case we forget to create a new node pool for future tests.
The last thing I wanted to mention here, we were considering 1-node per test semantics for resource-hungry tests, e.g. ReactJS environments. This can be achieved with additional labels and pod anti-affinity as discussed previously. We might add this on a case-by-case basis.
Consolidated Dev and Prod
We have a relatively simple setup for a small team: dev and prod. Each environment consists of a GKE cluster and a Postgres database (and some other things not related to cost savings).
I went to a Kubernetes meetup in San Franciso in September and discovered a cool tool called vcluster. It allows you to create virtual Kubernetes clusters within the same Kubernetes cluster, so developers can get access to fully isolated Kubernetes clusters and install whatever they want inside without messing up the main cluster.
They have nice documentation, so I will just share how it impacted our cost savings. We moved from a separate GKE cluster in another project for our dev environment to a virtual cluster inside our prod GKE cluster. What that means:
We got rid of a full GKE cluster. Even not taking into account actual nodes, Google started charging a fee for cluster management recently.
We can share nodes between dev and prod clusters. Even empty nodes require around 0.5 CPU and 0.5 GB RAM to operate, so the fewer nodes, the better.
We save money on shared infrastructure, e.g. we don’t need two Grafana instances, Prometheus Operators, etc. because it is the same “physical” infrastructure and we can monitor it together. The isolation between virtual clusters happens on the namespace level and some smart renaming mechanics.
We save money by avoiding paying for extra load balancers. Vcluster allows you to share ingress controllers (and other resources you’d like to share) between clusters, a kind of parent-child relationship.
We don’t need another cloud database, we moved our dev database to the prod database instance. You don’t have to do this step, but our goal was aggressive cost savings.
We had some struggles with Identity and Access Management (IAM) set up during this migration as some functionality required a subscription to vcluster, but we found a workaround.
We understand that there are certain risks with such a setup, but we are small-scale for now and we can always improve isolation and availability concerns as we grow.
Cloud Logging
I was reviewing our billing last month and noticed something strange - daily charges for Cloud Logging even though I couldn’t remember enabling anything special like Managed Prometheus service.

Google Cloud Logging Billing
I got worried as this would mean spending almost $100/month for I don’t know what. I was also baffled why it started in the middle of the month, I thought maybe one of the developers enabled something and forgot.
After some investigation, I found what it was:

Google Cloud Logging Volume
GKE Control Plane components were generating 100GB of logs every month. The reason I saw some charges in the middle of the month is there is a free tier of 50GB, so for the first two weeks there wouldn’t be any charges, and once you cross the threshold, you start seeing it in billing.
We already had somewhat optimized setup by disabling logging for user worklods:

GKE Cloud Logging Setup
We want to have control plane logs in case there are some issues, but this was way too much. I started investigating deeper and found that the vast majority of logs are info-level logs from the API Server. Those are often very basic and don’t help much with troubleshooting.
To solve this, we added an exclusion rule to the _Default Log Router Sink to exclude info logs from the API server:

Log Router Sink Exclusion Filter
As you can see on one of the previous images, the logging generation flattened out after applying this filter and we now have GKE logging under control. I’ve also added a budget alert specifically for Cloud Logging to catch this earlier in the future.
Conclusion & Next Steps
I wanted to see how much we can achieve without relying on any committed-use discounts or reserved instances as those approaches still cost money and are associated with extra risks, depending on if you buy 1 or 3-year commitments. Now, that we reduced our costs a lot, we can consider applying committed use discounts as those will be a pretty low risk at this level of costs.
I hope this will give you a few fresh ideas on how to optimize your own infrastructure as most of these decisions can be applied to all major cloud providers.

How Hands-On Lab Training Accelerates Your DevOps Learning Curve
In this article, we’ll explore why hands-on labs are so effective and how they can drastically improve your DevOps skills.
DevOps is a fast-paced, dynamic field where theoretical knowledge alone is rarely enough to succeed. To truly master the skills needed in this industry, hands-on experience is essential.
Hands-on lab training offers a practical, immersive way for DevOps engineers to accelerate their learning curve and become job-ready faster.
In this article, we’ll explore why hands-on labs are so effective and how they can drastically improve your DevOps skills.
1. Real-World Problem Solving
Learning by Doing
In DevOps, engineers face complex, real-world challenges daily. Hands-on labs simulate these real-life tasks, such as configuring a Kubernetes cluster, troubleshooting cloud infrastructure, or setting up CI/CD pipelines. This experience allows engineers to actively solve problems rather than passively learn concepts.
Why It Matters
Theoretical knowledge can only take you so far. Working on actual infrastructure and handling real problems solidifies what you’ve learned, ensuring you can apply those skills when it matters most—on the job.
Example: Many engineers use Brokee’s hands-on labs to practice AWS, Azure, and DevOps tasks that mirror real job environments.
Whether you’re an entry-level engineer or preparing for a new role, Brokee’s labs provide practical experience that accelerates your job readiness.

Brokee offers several labs and tests to practice DevOps and cloud skills, including Azure: Blob Challenge and Azure: Load Balancer
2. Builds Confidence for Day-One Readiness
Hands-On = Confidence
Many engineers struggle with confidence during their first few months on the job because they’ve never had the chance to apply what they learned in real scenarios. Hands-on labs give engineers the opportunity to practice these skills repeatedly until they are fully confident in their abilities.
Why It Matters
Confidence in your DevOps skills from day one can drastically shorten onboarding time and increase your productivity early in your career.
Companies often prefer candidates who have hands-on experience with the tools and technologies they use.

3. Mastering Tools and Platforms
Get Familiar with Industry-Standard Tools
Hands-on labs allow engineers to get comfortable using critical DevOps tools like Terraform, Ansible, Docker, Jenkins, and cloud platforms like AWS, Azure, and GCP.
Lab environments replicate real job tasks, so engineers can focus on mastering specific tools while understanding how they integrate into larger workflows.
Why It Matters
Becoming proficient with tools is crucial for DevOps roles. Hands-on labs provide the chance to not only learn new tools but to also understand how they function in complex environments.
Example: Engineers can practice setting up a continuous integration pipeline using Jenkins, deploy a containerized application with Kubernetes, or automate infrastructure with Terraform in a lab environment before applying these skills in production.
Read More: The Top DevOps Tools in 2024

4. Safe Environment to Make Mistakes
Learning Without the Pressure
One of the greatest advantages of hands-on lab training is the ability to make mistakes without real-world consequences.
In an actual job setting, errors can lead to downtime, security risks, or financial losses. In a lab, engineers can experiment, fail, and learn without the pressure of damaging live environments.
Why It Matters
The freedom to experiment helps engineers learn faster. They can try different approaches, discover what works, and learn from failures—all without impacting actual projects.
Read More: The Best DevOps Bootcamps in 2024

5. Speeds Up the Learning Curve
Accelerating Skill Development
Hands-on labs enable faster learning by giving engineers instant feedback. Instead of reading through documentation and theory, they can immediately see the results of their actions in the lab environment.
This kind of real-time feedback significantly speeds up the learning process, as engineers can adjust their approach on the fly.
Why It Matters
Learning by doing accelerates mastery of concepts and tools. Engineers gain a deep understanding of how different DevOps practices work together, which ultimately helps them become proficient more quickly than with theoretical learning alone.

6. Preparing for Certifications
Practical Experience for Exams
Certifications like AWS DevOps Engineer, Microsoft Azure DevOps, or Google Cloud Professional DevOps Engineer require not just theoretical knowledge, but also practical understanding. Hands-on labs prepare engineers for these exams by allowing them to practice the exact scenarios they’ll be tested on.
Why It Matters
While studying for certifications is important, real-world practice is what truly prepares you to pass the exams and apply the knowledge in the workplace. Hands-on labs give you the confidence and experience to tackle even the most challenging certification questions.
Example: In an AWS hands-on lab, engineers can set up auto-scaling groups, configure CloudWatch for monitoring, and use Lambda for automation—real-world tasks that they’ll likely face on the AWS DevOps Engineer certification exam.
Read More: AWS DevOps Interview Questions and Answers for 2024

7. Gaining Practical Job Experience
Simulate the Job Environment
Hands-on labs not only prepare engineers for exams but also simulate day-to-day job tasks.
These labs mirror the exact work you’ll do in a DevOps role, such as deploying cloud infrastructure, setting up monitoring systems, or configuring secure environments. The more practice you get, the more comfortable you’ll be when performing these tasks in a live environment.
Why It Matters
This kind of real-world experience is what hiring managers look for. By practicing in labs, engineers can demonstrate they are ready to step into a role without needing extensive on-the-job training.

Brokee’s live labs
Conclusion
Hands-on lab training is an invaluable tool for accelerating the DevOps learning curve.
Whether you're mastering tools, preparing for certifications, or gaining real-world job experience, these labs provide the perfect environment to learn by doing.
We currently offer 3 free labs for engineers (no credit card needed!), and after that, you can have access to our unlimited testing library for only $9 per month. Try Brokee risk-free today!
The practical experience gained from our labs will significantly boost your confidence, shorten onboarding time, and make you job-ready from day one.

Mastering Azure DevOps: Top Training Resources and Certifications to Kickstart Your Career
As businesses increasingly move to cloud-native solutions, mastering Azure DevOps has become essential for engineers aiming to boost their careers.
Whether you're starting your journey or looking to advance your skills, here’s a guide to the best Azure DevOps training resources and certifications that will help you stand out in this fast-growing field.
1. Microsoft Certified: DevOps Engineer Expert
What It Is
The Microsoft Certified: DevOps Engineer Expert certification is one of the most recognized credentials for Azure DevOps engineers. It validates your ability to combine people, processes, and technologies to deliver continuously improved products and services.
What You’ll Learn
How to design and implement DevOps processes
Using version control systems like Git
Implementing CI/CD pipelines
Managing infrastructure using Azure DevOps and tools like Terraform and Ansible
Why It’s Important
This certification proves you can create and implement strategies that improve software development lifecycles, a critical skill for Azure DevOps engineers.
Recommended Resources:
Microsoft Learning Path: Free modules on the official Microsoft site provide a structured learning path to pass the certification.
Whizlabs and Udemy Courses: These platforms offer in-depth preparation courses for this certification.

2. AZ-400: Designing and Implementing Microsoft DevOps Solutions
What It Is
AZ-400 is the exam required to earn the Microsoft Certified: DevOps Engineer Expert certification. It covers designing and implementing DevOps practices for infrastructure, CI/CD, security, and compliance.
What You’ll Learn
How to integrate source control and implement continuous integration
Strategies for automating deployments and scaling infrastructure
Monitoring cloud environments and managing incidents effectively
Why It’s Important
Passing this exam is crucial for anyone aiming to specialize in Azure DevOps. It showcases your ability to manage full lifecycle DevOps processes in Azure environments.
Recommended Resources:
Microsoft Learn: This free resource offers structured modules and practice tests.
Udemy: The AZ-400 Exam Preparation Course is a highly rated resource for detailed exam preparation.
3. LinkedIn Learning: Azure DevOps for Beginners
What It Is
This LinkedIn Learning course is an excellent introduction for beginners to Azure DevOps, covering the basics of using the platform for continuous delivery, infrastructure management, and monitoring.
What You’ll Learn
Setting up an Azure DevOps environment
Managing code repositories with Git
Implementing CI/CD pipelines using Azure Pipelines
Why It’s Important
If you’re new to DevOps or just getting started with Azure, this course provides a solid foundation for understanding the tools and practices needed to succeed.
Recommended Resources:
LinkedIn Learning Subscription: Offers access to this and thousands of other related courses.
4. Pluralsight: Azure DevOps Fundamentals
What It Is
Pluralsight offers an in-depth course that covers core Azure DevOps concepts, including project management, version control, and pipeline automation.
What You’ll Learn
How to manage Azure DevOps organizations, projects, and teams
Configuring CI/CD pipelines for automated builds and deployments
Automating infrastructure with Terraform and Azure Resource Manager
Why It’s Important
For those who already have a basic understanding of DevOps, this course dives deeper into Azure-specific functionalities, preparing you for hands-on work with Azure projects.
Recommended Resources:
Pluralsight Subscription: Provides unlimited access to this course and other DevOps-related content.

5. Azure DevOps Hands-On Labs
What It Is
Hands-on labs offer practical, real-world experience by simulating real tasks and challenges within Azure DevOps environments. Labs allow engineers to practice and test their knowledge in controlled scenarios that mirror actual job tasks.
Why It’s Important
Nothing beats hands-on experience when learning new tools. Labs allow engineers to practice and refine their skills by working on real-world problems, making them invaluable for both beginners and those preparing for certifications.
Recommended Resources:
Brokee DevOps Assessments: Brokee offers real-world cloud-based assessments that simulate job environments, helping engineers practice hands-on Azure DevOps tasks and allowing companies to assess candidates' proficiency in real-time.
6. GitHub Learning Lab: CI/CD with GitHub Actions and Azure
What It Is
GitHub Learning Lab provides an interactive guide to integrating GitHub Actions with Azure for CI/CD pipelines. It's a great way to learn how to automate workflows and deployments using GitHub alongside Azure DevOps.
What You’ll Learn
Automating code builds and deployments with GitHub Actions
Integrating GitHub repositories with Azure environments
Best practices for implementing automated workflows in cloud environments
Why It’s Important
With many organizations using GitHub for code management, this course equips you with the skills to merge GitHub's powerful automation tools with Azure's cloud infrastructure.
Recommended Resources:
GitHub Learning Lab: Free access to interactive, self-paced courses.

Conclusion
Azure DevOps is a critical skill set for anyone entering the cloud engineering space, and mastering it requires both theoretical knowledge and practical experience.
By leveraging the right training resources and certifications, you can position yourself for success in a competitive job market.

Top 10 SRE Tools Every DevOps Engineer Should Know About
As a DevOps engineer, knowing the right tools for the job is essential to managing and optimizing complex infrastructures.
Let's explore the top 10 SRE tools every DevOps engineer should be familiar with.

Site Reliability Engineering (SRE) plays a crucial role in ensuring systems are reliable, scalable, and performant.
As a DevOps engineer, knowing the right tools for the job is essential to managing and optimizing complex infrastructures.
Below are the top 10 SRE tools every DevOps engineer should be familiar with, whether they’re focused on monitoring, automation, or incident management.
1. Prometheus
What is Prometheus?
Prometheus is an open-source monitoring and alerting toolkit designed for reliability. It collects metrics from various sources, stores them in a time-series database, and allows engineers to set up powerful alerting based on predefined thresholds.
Why You Need It
Prometheus is widely adopted for system monitoring due to its scalability and flexibility. It integrates seamlessly with Kubernetes and other cloud-native environments, making it an essential tool for SREs and DevOps engineers alike.

Displaying Prometheus Metrics in Grafana
2. Grafana
What is Grafana?
Grafana is an open-source data visualization and analytics tool that integrates with Prometheus and other data sources to provide real-time dashboards.
Why You Need It
Grafana’s customizable dashboards give teams a clear visual overview of system health, performance metrics, and potential bottlenecks. This allows SREs to spot issues quickly and maintain system reliability.

Grafana Dashboard
3. Terraform
What is Terraform?
Terraform by HashiCorp is a powerful tool for Infrastructure as Code (IaC). It enables engineers to define cloud infrastructure resources using declarative code, which can be version-controlled and automated.
Why You Need It
Automating infrastructure provisioning with Terraform reduces human error and ensures consistency across environments. For SREs, this means more reliable deployments and faster recovery from incidents.

High-Level Idea of Terraform
4. Kubernetes
What is Kubernetes?
Kubernetes is the most popular container orchestration platform, used to manage and scale containerized applications across clusters.
Why You Need It
Kubernetes automates the deployment, scaling, and management of containerized applications. Its self-healing capabilities, auto-scaling, and robust ecosystem make it an indispensable tool for any SRE or DevOps engineer focused on maintaining reliability.

Kubernetes in a Nutshell
5. PagerDuty
What is PagerDuty?
PagerDuty is an incident management platform designed to help DevOps and SRE teams respond to incidents in real-time.
Why You Need It
PagerDuty integrates with monitoring tools and alerts teams when something goes wrong. It helps organize and escalate incidents, ensuring that the right people respond promptly to minimize downtime and system impact.

The PagerDuty Suite of Tools
6. Ansible
What is Ansible?
Ansible is an open-source tool for automation and configuration management. It allows for the automation of application deployment, cloud provisioning, and system configurations.
Why You Need It
SREs use Ansible to automate repetitive tasks, reducing manual intervention and minimizing configuration drift across environments. It’s essential for maintaining consistent and reliable infrastructure.

Ansible Automation Platform
7. ELK Stack (Elasticsearch, Logstash, Kibana)
What is the ELK Stack?
The ELK Stack is a combination of three tools: Elasticsearch (search and analytics engine), Logstash (log pipeline), and Kibana (visualization).
Why You Need It
This stack is perfect for log management, allowing SREs to collect, analyze, and visualize logs in real-time. With ELK, you can identify and troubleshoot issues across distributed systems, improving reliability and system observability.

Logs Web Traffic and More
8. Jenkins
What is Jenkins?
Jenkins is a popular open-source automation server used to build and manage CI/CD pipelines.
Why You Need It
SREs rely on Jenkins to automate the building, testing, and deployment of code. With its broad plugin ecosystem, Jenkins integrates with many tools and platforms, making it a key player in ensuring smooth and reliable software delivery.

Jenkins Dashboard
9. Datadog
What is Datadog?
Datadog is a monitoring and analytics platform for cloud applications, offering real-time insights into system performance.
Why You Need It
Datadog combines metrics, traces, and logs into a single platform, enabling SREs to monitor cloud infrastructures, troubleshoot issues quickly, and maintain system performance with greater clarity.

DataDog Performance Overview
10. Runbook Automation (Rundeck)
What is Rundeck?
Rundeck is a runbook automation tool that helps SREs create and execute automated procedures to handle system operations and incidents.
Why You Need It
Automating routine tasks and operational procedures with Rundeck reduces human error, speeds up incident resolution, and allows SREs to focus on more strategic tasks, all while maintaining system reliability.

Rundeck Automation Platform Layout
Conclusion
Mastering these tools will equip any DevOps engineer or SRE to manage and scale infrastructures with confidence.
From monitoring and observability with Prometheus and Grafana, to automating infrastructure and workflows with Terraform and Ansible, each tool plays a pivotal role in ensuring system reliability and efficiency.
Want to hone your ability to use SRE tools? Brokee’s assessments incorporate real-world tasks using these essential SRE tools, helping engineers hone their skills and allowing companies to evaluate candidates’ hands-on proficiency.